Version 2: Tests (2012)
Testing Version 2 by reading analog values of all 8 bend sensors via Arduino and via the x-IMU.
Arduino Test
Hand
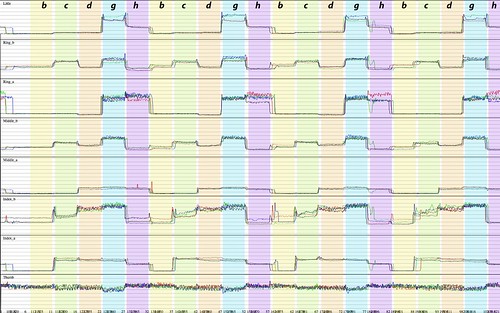
The following graphs show the raw sensor data (0-5V from arduino) from all 8 sensors, mapped to 1/8 of the window height. Using 10K Ohm internal pull-up resistors. Numbers at the bottom of the screen indicate time (in seconds) since application started running. The thumb sensor is extremely insensitive – please ignore it for now. The sensor on the middle finger finger-knuckle is very tight, that is why the graph values are low to start with. Larger versions of all the images can be found in the Flickr set.
Sensor names are printed in the top left corner of each graph row (a = finger knuckle, b = hand knuckle) but for clarity here again, from top to bottom:
Little = little finger
Ring_b = ring finger, hand knuckle
Ring_a = ring finger, finger knuckle
Middle_b = middle finger,hand knuckle
Middle_a = middle finger, finger knuckle
Index_b = index finger, hand knuckle
Index_a = index finger, finger knuckle
Thumb = thumb
Parsing through hand postures b, c, d, g and h (see bellow for posture image). Some of the irregularities come because i make a mistake when switching from one posture to the next. I went though the graph window 4 times (first = black, second = red, third = green, fourth = blue), changing posture every 5 seconds.
Video of hand postures (just for reference):
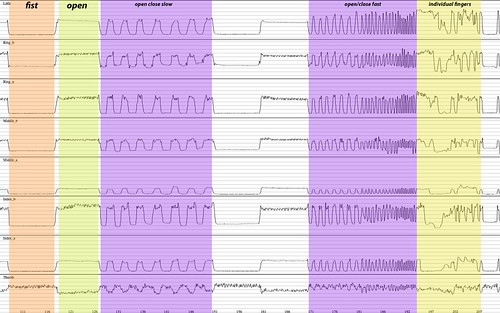
Annotated graph of all eight sensors, opening and closing hand at different speeds for different durations:
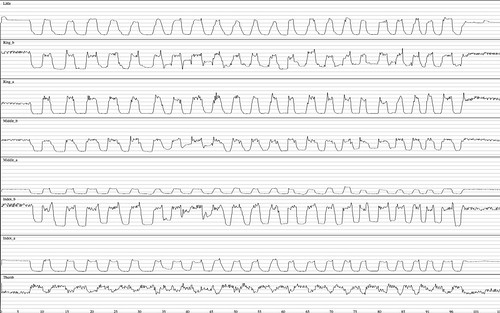
Graph of all eight sensors, opening and closing hand:
Single Finger
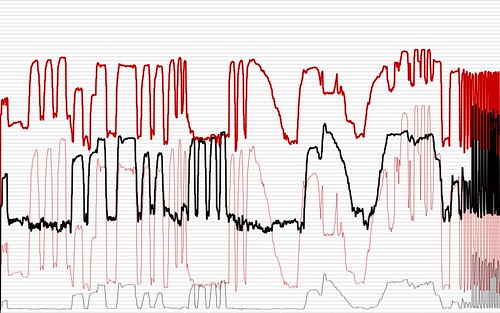
The following screenshot and video show a graph plot of the sensor data from the middle finger (red = finger knuckle, black = hand knuckle). The bold lines are the raw sensor data (external 10K Ohm pull-down resistor), the lighter lines are an attempt to linearize the raw sensor data using the following code, and i have no idea if what i am doing makes any sense!
mappedValues[i] = map(incomingValues[i], 0,1023, 0,7);
//change from log to linear and multiply by 100 to make it more visible:
linearValues[i] = exp(mappedValues[i]-4) * 100;
Screenshot
Video
Test Setups
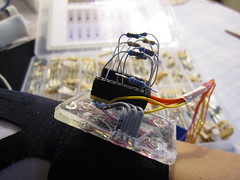
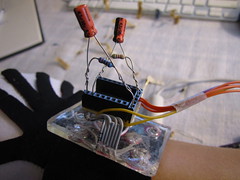
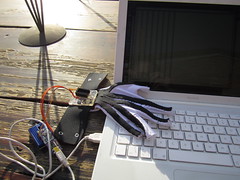
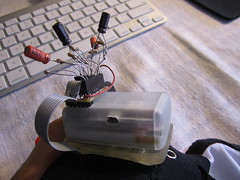
Figuring out my test setup… testing various resistor values and capacitors:
Videos
x-IMU Test
Test setup…


Raw vs. Calibrated Data
Before finding the proper scaling arrows:
After finding the scaling arrows:
The sensors on the glove connect to the following X-imu axillary ports:
———–
AUX 0 = little
AUX 1 = thumb
———–
AUX 2 = middle_a = finger-knuckle
AUX 3 = middle_b = hand-knuckle
———–
AUX 4 = ring_a = finger-knuckle
AUX 5 = index_a = finger-knuckle
———–
AUX 6 = ring_b = hand-knuckle
AUX 7 = index_b = hand-knuckle
———–
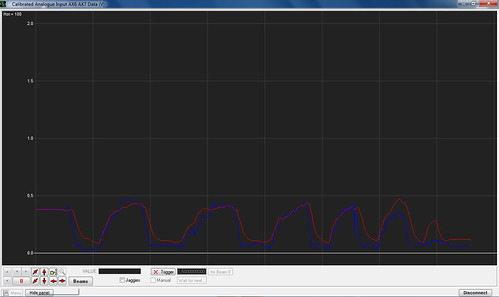
AUX6&7) Ring and index finger hand-knuckles (with a 10uF capacitor on AUX6, red):
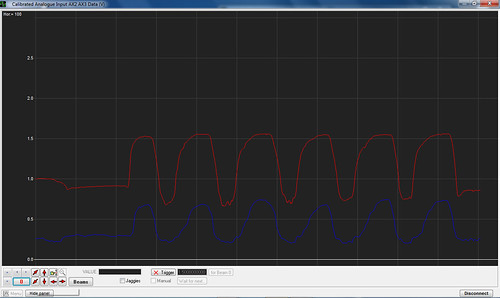
AUX2&3) Middle finger hand and finger-knuckle (with a 4.7uF capacitors on both):
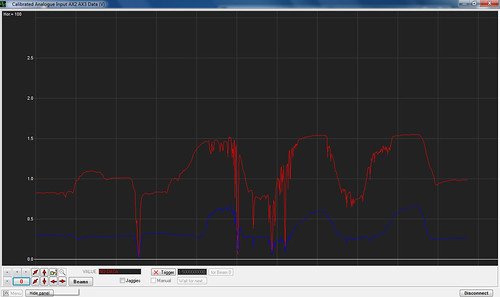
Not quite sure what triggered these spikes. Maybe bad connections. It did not seem related to triggering (squeezing) multiple sensors at once.
AUX4&5) Ring and index finger finger-knuckles:
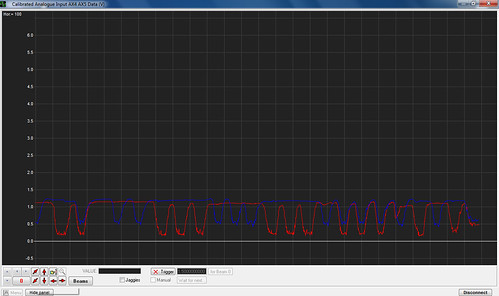
Video
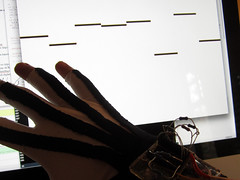
The screen of the PC i borrowed is super reflective, so it was hard to get a video that shows the graph lines well. But it is nice because you can see in the reflection how i am flexing the fingers of my hand.